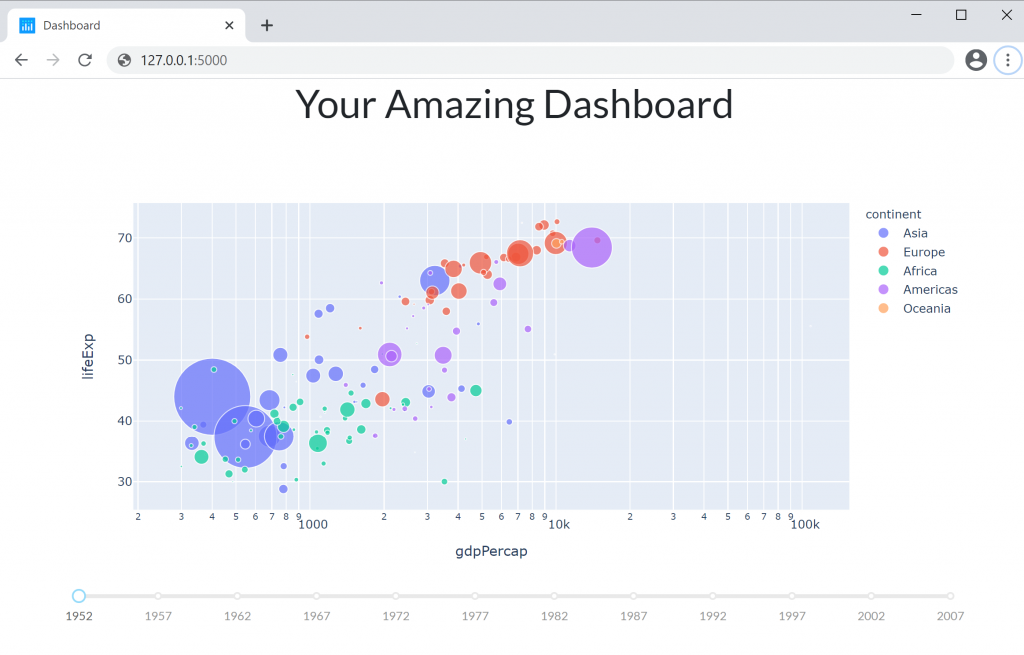
As we have already said in an older article the plotly/dash library is awesome. In this article, we are going to present the way how you can share your dashboard application with other people. By default, Dash apps run on localhost – you can only access them on your own machine. To share a Dash app, you need to “deploy” it to a server. If you don’t have your own server there are solutions many solutions, some of them are Heroku, PythonAnywhere, and of course the Dash Enterprise. In our implementation, we will present it in our local webserver.
Let’s start from the ingredients!
To easily exercise what we discuss in this article, we need to install a minimal set of tools required to manage containerized environments locally:
- Windows or macOS: Install Docker Desktop [Get Started with Docker | Docker]
- Linux: Install Docker[Get Docker | Docker Documentation] and then Docker Compose[Install Docker Compose | Docker Documentation]
We show how to do this with a Flask service such that we can run it standalone without needing to set up other components.
app.py

 from dash.dependencies import Output, Input, State
 import dash_bootstrap_components as dbc
 import dash_core_components as dcc
 import dash_html_components as html
 import plotly.express as px
 from flask import Flask
 import pandas as pd
 import dash

 server = Flask(__name__)
 app = dash.Dash(server=server, external_stylesheets=[dbc.themes.FLATLY])
 app.title = 'Dashboard'

 df = pd.read_csv('https://raw.githubusercontent.com/plotly/datasets/master/gapminderDataFiveYear.csv')

 app.layout = dbc.Container([

     dbc.Row(dbc.Col(html.H2("Your Amazing Dashboard"), width={'size': 12, 'offset': 0, 'order': 0}), style = {'textAlign': 'center', 'paddingBottom': '1%'}),

     dbc.Row(dbc.Col(dcc.Loading(children=[dcc.Graph(id ='your-graph'),
                                           dcc.Slider(id='year-slider',
                                                     min=df['year'].min(),
                                                     max=df['year'].max(),
                                                     value=df['year'].min(),
                                                     marks={str(year): str(year) for year in df['year'].unique()},
                                                     step=None)
                                         ], color = '#000000', type = 'dot', fullscreen=True ) ))
 ])

 @app.callback(
     Output('your-graph', 'figure'),
     Input('year-slider', 'value'))
 def update_figure(selected_year):
     filtered_df = df[df.year == selected_year]

     fig = px.scatter(filtered_df, x="gdpPercap", y="lifeExp",
                      size="pop", color="continent", hover_name="country",
                      log_x=True, size_max=55)

     fig.update_layout(transition_duration=500)

     return fig

 if __name__=='__main__':
     app.run_server()
In order to run it, we need to make sure we have all the required libraries installed. For this we need to create a requirements.txt file and write the dependencies in it. It is important on this step to add inside the gunicorn library, is a Python WSGI HTTP Server for UNIX. It’s a pre-fork worker model. The Gunicorn server is broadly compatible with various web frameworks.
requirements.txt

 pip==21.0.1
 wheel==0.36.2
 setuptools==53.0.0
 Brotli==1.0.9
 click==7.1.2
 dash==1.19.0
 dash-bootstrap-components==0.11.2
 dash-core-components==1.15.0
 dash-html-components==1.1.2
 dash-renderer==1.9.0
 dash-table==4.11.2
 Flask==1.1.2
 Flask-Compress==1.8.0
 future==0.18.2
 itsdangerous==1.1.0
 Jinja2==2.11.3
 MarkupSafe==1.1.1
 numpy==1.20.0
 pandas==1.2.1
 plotly==4.14.3
 python-dateutil==2.8.1
 pytz==2021.1
 retrying==1.3.3
 setuptools==53.0.0
 six==1.15.0
 Werkzeug==1.0.1
 gunicorn==20.0.4
This is the folder structure:
  +-- app
 |   +-- app.py            // source code of dashboad application
 |   +-- requirements.txt  // libraries
 +-- .env                  // configuration about where the app runs
 +-- docker-compose.yaml   // build instructions
 +-- Dockerfile            // docker image instructions
We create a dedicated directory for the source code to isolate it from other configuration files.
First, it needs to install a Python interpreter and run it. The way to get our Python code running in a container is to pack it as a Docker image and then run a container based on it. A Dockerfile containing instructions for assembling a Docker image.
 Dockerfile

 FROM python:3.8-slim-buster
 RUN apt-get update
 RUN apt-get install nano

 RUN mkdir wd
 WORKDIR wd
 COPY app/requirements.txt .
 RUN pip3 install -r requirements.txt

 COPY app/ ./

 CMD [ "gunicorn", "--workers=5", "--threads=1", "-b 0.0.0.0:80", "app:server"]
Finally, the .env and .yaml file which includes configures of the application’s services
 .env

 COMPOSE_PROJECT_NAME=dash-app
docker-compose.yaml
version: '3.7'
services:
dashboard:
build:
context: ./
container_name:  {COMPOSE_PROJECT_NAME}_dashboard
restart: always
ports:
- 5000:80
networks:
- network
networks:
network:
driver: bridge
{COMPOSE_PROJECT_NAME}_dashboard
restart: always
ports:
- 5000:80
networks:
- network
networks:
network:
driver: bridgeThe last step is to navigate inside of the main folder and run the type the following commands:
docker-compose build
docker-compose up
….and voila!

If you built your app locally visit: 127.0.0.1:5000 otherwise, use your server’s IP xxx.xxx.xxx.xxx:5000 in a browser and see your dash application!
source code here: https://github.com/atheo89/dashboard-deployment


